- The Invesco FTSE RAFI UK 100 fund, is one of the most underused funds in the IA UK All Companies sector yet over the past 1, 3 & 5 years it has been one of the best performers.
- The iShares Oil & Gas Exploration & Production fund has benefited significantly from the energy crisis, which has contributed to the fund returning a remarkable 115% in the past 12 months.
- Over the past 12 months the iShares S&P 500 Information Technology Sector fund returned growth of 8.04%, despite the sector averaging losses of -17.69% for the period.
A recent report by industry trade body the Investment Association identified that 20% of the money invested in funds by UK investors is held in tracker funds.
The speed at which passive tracker funds have grown in popularity has been extraordinary as just 10 years ago they accounted for 8% of the UK investment fund market.
With £290 billion now held in passive funds in the UK, the number of passive fund options continues to evolve and get bigger. But not all passive funds are the same. The performance of same sector passive funds can vary, sometimes significantly, as many same sector funds choose to track different indexes, which has caused confusion among investors, especially those considering tracker options for the first time. As a consequence it is important to assess the quality of all funds, including passive funds to identify the good from the bad.
In this report, we look at why the performance of passive funds can differ, and we also identify 10 tracker funds across a range of sectors that have consistently outperformed both active and passive funds within those sectors.
Passive Investing
Passive funds, also known as tracker funds, aim to track the performance of a particular index, or stock market. For example the FTSE 100, which is made up of the UK’s largest 100 companies. This approach is different from actively-managed funds where professional fund managers invest into a select number of companies, with the aim to beat the performance of an index.
Most tracker funds typically invest in every stock that makes up the index it’s trying to replicate – known as full replication. Some funds won’t invest in every stock, but they’ll hold a sample of shares which represent the wider index. This is known as partial replication.
Either way, buying and selling companies involves costs which can eat away at performance. To keep the fund’s performance as close to the index as possible, tracker funds use techniques like reinvesting dividends at an appropriate time to keep costs to a minimum.
According to the promoters of passive investing, tracking the performance of a chosen market is cheaper, delivers better performance, and is more reliable than active funds, which rely on a fund manager to pick the stocks and manage the fund.
The Attraction of Passive Investing
There are two main features of passive / tracker funds that have contributed most to their popularity among UK investors:
Cost
One of the main attractions of passive investing is its low cost compared to the higher charges associated with actively managed funds. The reason passive funds are generally cheaper is because active funds are more expensive for fund management firms to maintain as they need to pay research analysts and portfolio managers, as well as additional costs due to more frequent trading. Whereas passive funds simply track a set index which is maintained by computers and complex algorithms with no hands on management or resources required.
Although cost is important, it is important to remember that your reason for investing is firstly to grow your wealth, not to save money. Naturally, lower costs are better than higher costs, but receiving value should be the focus. The opportunity cost of opting for passive funds could be huge when ignoring the active fund managers that consistently produce top returns within their sector.
Performance
Passive funds are often viewed as better performing alternatives to traditional actively managed funds, which are also typically more expensive. By their very nature, passive funds will simply track the index in which they are replicating, so their performance is almost entirely dependent on how that index performs.
As research shows, on average, more active funds perform below the index than above it, which leads many to conclude that passive funds are better. But it is not that simple, the fact is the investment fund market is littered with poor quality funds, funds that pull the average growth of active funds down considerably. The level of expertise between active fund managers can vary greatly, with some continually excelling and achieving returns from their funds that passive funds are unable to replicate. Therefore, quality actively managed funds can outperform the passive counterparts considerably.
Why The Performance of Funds That Track The Same Index Can Differ
It is important to keep in mind when comparing tracker funds within the same sectors that they may not all track the same index as there are significantly more indexes to track than there are sectors.
For example, the Vanguard US Equity Index fund and the L&G US Index Trust are both classified within the IA North American Sector. However the Vanguard US Equity Index fund tracks the ‘S&P Total Market Index’ and the L&G US Index Trust tracks the ‘FTSE World USA Index’.
The FTSE World USA Index has a basket of 600 constituents but the S&P Total Market Index has almost 4,000 constituents. Although these passive funds are in the same sector they each track different indexes, therefore, we can expect their returns to differ somewhat.
However, the performance of passive funds that track the same index can also differ. Tracking error is often cited as a key factor in the difference in returns of a passive funds performance compared to similar tracker funds. Tracking error is a fundamental measure of how well the job is being done.
A tracker’s role is to deliver the returns of its benchmark index. In an ideal world, if the FTSE All-Share index returns 15% a year, then a FTSE All-Share tracker will also return 15%. But this is rarely the case, as tracking errors can result in a notable variation between passive funds with similar objectives.
This is an important consideration for passive investors because it can reveal which passive tracker funds offer the most value for money. There’s no point choosing a passive fund with a total cost that is 0.2% cheaper than its rivals if its returns consistently fall below the same benchmark by an extra 0.5%.
There are two primary ways that passive investment funds mimic the performance of an index.
Full replication
This is the process of buying all components of an index. For example, a FTSE 100 tracker fund will buy shares in all 100 companies in the index, in proportion to the size of the companies within the index. This means that funds can mirror the performance of the index as closely as possible.
Partial replication
When it is difficult to buy all the shares in an index, some passive funds invest in a sample of an index that is generally representative of the whole index. A good example of this is the MSCI World index. This comprises more than 1,700 companies from 23 countries. The time and cost it would take to hold all the companies in the index for full replication could be detrimental to the portfolio. Instead, many passive funds will purchase a sample of the companies that are most representative of the index itself.
This approach is known as sampling, and it aims to match the characteristics of the index and track its returns, without necessarily buying all the securities in the index is not as straightforward as you may think. It requires experienced teams to evaluate the relative value and creditworthiness, particularly for corporate and government bonds.
The Best Tracker Funds
Below we feature 10 tracker funds that have consistently outperformed their sector peers, which includes both active and passive funds over the past 1, 3 & 5 years. These funds have and continue to represent some of the best investment opportunities across a range of markets.
![]()
iShares Oil & Gas Exploration & Production
The iShares Oil & Gas Exploration & Production fund. As its name suggests, the fund seeks to track the performance of an index composed of global companies involved in the exploration and production of oil and gas. The fund carries a high risk rating of 8 in the Dynamic Planner risk scale of 1-10, with 1 being the lowest risk and 10 the highest. The fund is classified within the IA Commodity/Natural Resources sector and although it tracks the S&P Commodity Producers Oil and Gas Exploration & Production Index, the majority of the funds asset allocation is in North America, which makes up 86% of the funds holdings.
The fund has benefited significantly from the energy crisis, which has contributed to the fund returning a remarkable 115% in the past 12 months.
HSBC MSCI World
The Fund aims to track as closely as possible the returns of the MSCI World Index. The Index is made up of large and mid-cap companies of the world’s developed countries, as determined by the Index provider. The fund is passively managed but it utilises an investment technique called optimisation. This technique seeks to minimise the difference in return between the fund and the Index by taking into account tracking error and trading costs. Also, the HSBC MSCI World fund will not necessarily invest in every company that comprises the Index, or invest proportionally to each company’s weight in the Index, so its performance will often differ from the index itself and other funds that track the same index.
Although the MSCI World Index is a global index, it is primarily made up of North American companies and as such the fund has a heavy weighting in North America, which investors must factor into their portfolio's asset model if investing in this fund. The fund has enjoyed strong performance within the highly competitive Global sector with returns consistently above the sector average.
Fidelity Index World
Similar to the HSBC MSCI World fund, the Fidelity Index World fund is classified within the IA Global sector and it also seeks to track the performance of the MSCI World Index. However, for practical reasons and to reduce the dealing costs of the fund, it doesn’t invest in every company share in the index or at its weighting within the index. This is a similar approach to the HSBC MSCI World fund but as the funds within the index that they exclude can differ their performance is slightly different. Over the past 1, 3 & 5 years the Fidelity Index World fund has delivered returns that are slightly below that of the HSBC MSCI World fund. Yet it still ranks as one of the most consistent top performers in the sector.
L&G Global Emerging Markets Index
The L&G Global Emerging Markets Index fund aims to FTSE Emerging Index and is classified with the IA Global Emerging Markets sector along with 148 other funds. Emerging markets is typically a higher risk investment sector and the L&G Global Emerging Markets Index has a Dynamic Planner risk rating of 10. As such, investing in emerging markets funds is typically reserved for more adventurous investors. Emerging markets have endured a tough year, with the sector averaging negative returns of -9.16%. But the L&G Global Emerging Markets Index fund has done much better mitigating the past year's losses to -1.21%. Over 3 & 5 years, the fund has also managed to deliver returns that are above the sector average.
iShares S&P 500 Health Care Sector
The Fund seeks to track the performance of an index composed of U.S. Health Sector companies as defined by the Global Industry Classification Standard (GICS). Although the fund is almost entirely composed of North American equities, the nature of the companies it invests in means it is classified within the IA Healthcare sector along with 73 competing funds. This fund has a risk rating of 7 out of 10 and performance wise it has been excellent, with 1, 3 & 5 year returns of 14%, 60.30% and 94.41% among the best in the entire sector.
Vanguard LifeStrategy 80% Equity
The Vanguard LifeStrategy 80% Equity fund is the most popular and widely recognised of the 10 funds we feature in this report. The fund differs from other passive funds as it doesn’t track one particular index, instead it acts as a readymade portfolio by investing proportionately across a range of Vanguard's passive funds.
The fund has a mid range risk rating of 6 out of 10 and due to its diverse composition, it is classified within the IA Mixed Investments 40-85% Shares sector where it has continually ranked among the top performers. Over the past 3 & 5 years this fund returned growth of 23.9% and 38.84%.
HSBC S&P 500
The HSBC S&P 500 fund aims to track as closely as possible the returns of the S&P 500 Index, which is an index that consists of the 500 largest companies in the U.S. The S&P 500 is widely regarded as the best single gauge of large-cap U.S. equities.
The fund aims to track the index by proportionately investing in the shares of the companies as per the Index. But as this is not always possible, the fund will not necessarily be invested in all 500 companies within the index. However, the fund has still consistently performed better than the majority of the funds in the IA North American sector over the past 1, 3 & 5 years with returns of 10.09%, 59.63% and 100.79% respectively.
iShares US Property Yield
The iShares US Property Yield fund has a risk rating of 8 and it is another fund that is entirely weighted in North American equities. However, as the fund seeks to track the performance of an index composed of US listed real estate companies, it is classified within the IA Property sector along with 40 other property focused funds. The fund has consistently excelled in this sector ranking 2nd for performance over 1 years with returns of 11.59% and ranking 3rd over 3 & 5 years with returns of 16.12% and 40.42%.
iShares S&P 500 Information Technology Sector
The iShares S&P 500 Information Technology Sector fund, as its name suggests, seeks to track the performance of an index composed of U.S. Information Technology Sector companies. The fund is responsible for managing almost £3 billion of investor assets, which makes it one of the most popular funds in the IA Technology & Telecommunications sector. It’s popularity is warranted as over the past year it has been the top performing fund in the entire sector with growth of 8.04%, which is particularly impressive as the sector itself averaged losses of -17.69% for the period. Over 3 & 5 years the funds performance was equally strong with returns of 98.29% and 190.02% more than double that of the sector average.
Invesco FTSE RAFI UK 100
The Invesco FTSE RAFI UK 100 launched in 2007 and despite being more than 15 years old, the fund has only amassed a very low £9.49 million of funds under management, making it one of the smallest funds in the IA UK All Companies sector. Yet despite remaining a relatively unknown fund, it has an exceptional performance history unrivalled by almost all other funds in the sector. Over the past year the fund returned 15.20% which ranked 2nd out of 935 funds in the sector and was well above the sector average of -7.79%.
Investing In Proven Quality
This report focuses only on passive funds, but there are a selection of exceptional active funds on the markets that can, in some instances, offer even more attractive growth opportunities. However, the 10 funds featured in this report represent some of the top performing tracker funds on the market. Their performance has ranked among the best when compared against other active and passive funds within the same sectors.
Although these funds have been among the top performers, how they perform going forward is not guaranteed. However, our research shows that the funds with a consistent history of outperformance are more likely to continue to outperform compared to the funds and fund managers who have a more chequered performance history.
Their strong performance when markets have been both stable and highly volatile supports the view that they are well placed to maintain competitive growth going forward.
Does Your Portfolio Contain Top Performing Funds?
Inefficient investing will undoubtedly have adverse long-term consequences. It is so important to distinguish the funds and fund managers who outperform their peers in order to ensure your portfolio is made up of high-quality funds.
Our free portfolio review service has helped thousands of investors identify areas for improvement and provide complete clarity as to the quality of advice they have received.
Our portfolio review service will provide an independent analysis of your portfolio and identify:
- If your portfolio contains top, mediocre or poor performing funds
- How your portfolio growth compares to a similar risk portfolio of top-performing funds
- Potential areas for improvement
- The overall quality rating of your portfolio
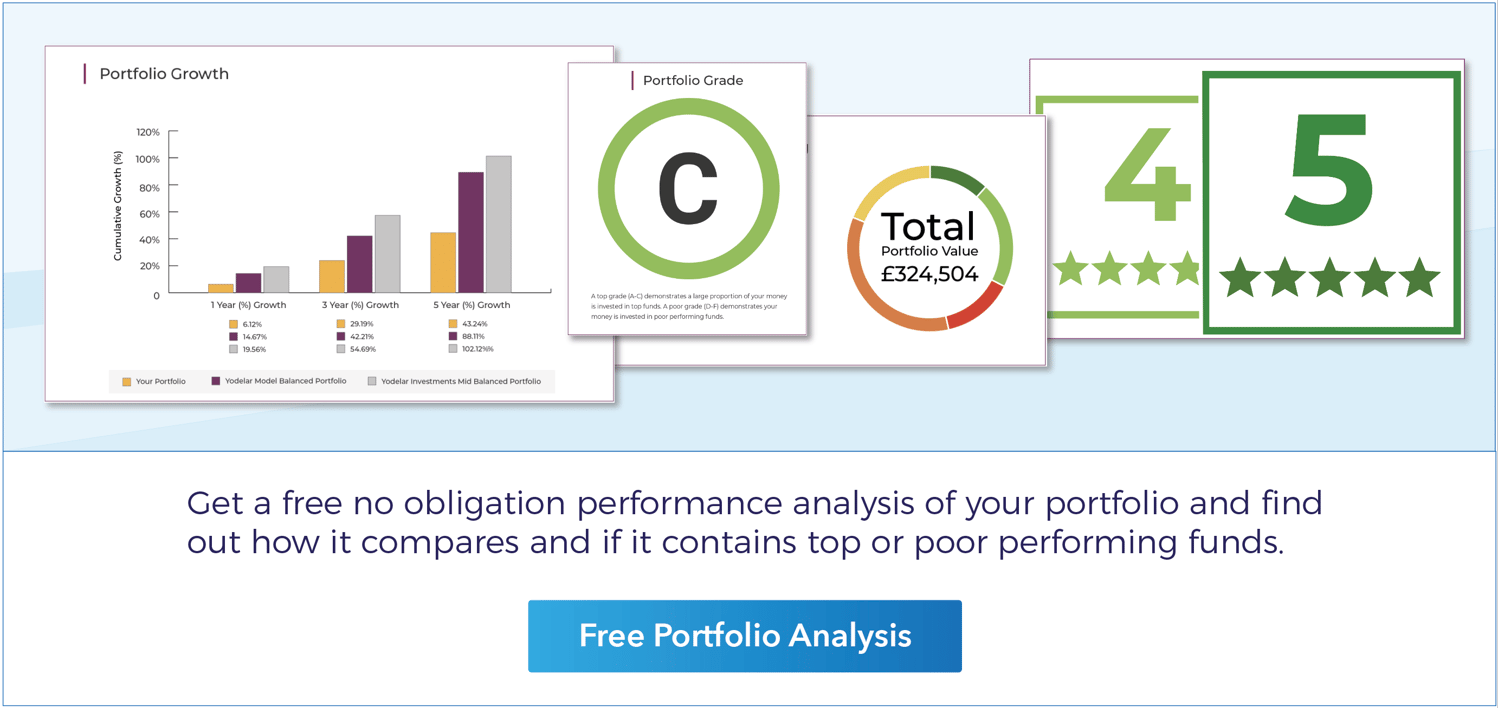
Our portfolio analysis feature provides a clear insight into how each of your individual funds is performing while grading your portfolio based on its overall performance - making it easy to identify weak points or areas for potential improvement.
Upload your portfolio for a comprehensive portfolio review and find out how competitive the performance of your portfolio has been and if the advice you have received to date has been up to par.


