- Over the past 1, 3, & 5 years, the Xtrackers MSCI USA Information Technology ETF delivered the highest returns in the IA North America sector, with 46.58%, 78.63%, and 211.48%, respectively.
- 107 of the 563 passive funds analysed received a top performing 4 or 5 star rating.
- The Invesco FTSE RAFI UK 100 fund, is one of the most underused funds in the IA UK All Companies sector yet over the past 1, 3 & 5 years it has been one of the best performers.
The UK's passive fund market has grown to more than £560 billion in recent years, reflecting a trend towards lower fees and more predictable returns compared to active funds.
Recent analyses show passive funds are increasingly outperforming active funds, which are often more susceptible to volatility. A report by AJ Bell revealed that only 34% of active equity funds outperformed passive alternatives in 2023.
However, not all passive funds are created equal. To help investors navigate this landscape, we conducted a comprehensive analysis of 563 passive funds available to UK investors. In this report, we feature some of the best performing passive funds available to UK investors and provide access to a comprehensive report covering the performance, sector ranking and overall rating of all 563 funds.

Passive Fund Performance Summary
We have analysed 563 passive funds available to UK investors, covering multiple investment sectors to assess their performance and effectiveness against their peers, over the past 1, 3 & 5 year periods.
From this extensive range of 563 funds, 107 were awarded an impressive 4 or 5 star performance rating, with 60 funds receiving a 4-star rating and 47 funds achieving the highest 5-star rating. On the other hand, 150 funds had a modest 3-star rating.
However, 54.4% of these funds underperformed relative to their peers, showcasing the need for careful selection and evaluation when considering passive investment options in the UK market.

These findings underscore the importance of thorough research and careful selection when considering passive investment options. While passive funds offer potential benefits, not all perform equally well. Investors should look beyond the passive label and scrutinise individual fund performance to make informed decisions aligned with their financial goals.
Whilst passive funds generally outperform most actively managed funds a select group of top-performing active funds often achieve significantly higher returns than their passive counterparts. This exceptional performance from a small number of active funds tends to elevate the overall sector average. Consequently, many passive funds, despite their generally solid performance, may appear to underperform when compared to this inflated sector average. This creates a nuanced picture where passive investing remains a strong strategy for most investors, yet leaves room for outperformance by skilled active managers in certain cases.
For a comprehensive analysis of all 563 passive funds available to UK investors, including detailed performance data, sector rankings, and ratings over 1, 3, and 5 years, download the full PDF analysis.
What is Passive Investing
Passive funds, also known as tracker funds, aim to replicate the performance of a particular index, such as the FTSE 100. This approach differs from actively managed funds, where professional fund managers invest in a select number of companies with the goal of outperforming the index. Most tracker funds invest in every stock within the index they track, a method called full replication. Some, however, use partial replication, holding a representative sample of the index’s stocks. Despite incurring costs for buying and selling, tracker funds keep performance close to the index by reinvesting dividends appropriately.
A Passive investor accepts that they will not beat the market or sector averages and invest in a broad range of assets to generate average market returns. Promoters of passive investing argue that it is cheaper, delivers better performance, and is more reliable than active investing, which relies on fund managers to pick and manage stocks.

Attraction of Passive Investing
Two main features of passive / tracker funds have contributed most to their popularity among UK investors:
Cost: One of the main attractions of passive investing is its low cost compared to the higher charges associated with actively managed funds. Passive funds are generally cheaper because they track a set index maintained by computers and algorithms, without the need for hands-on management or resources. Active funds, on the other hand, require research analysts, portfolio managers, and incur additional costs due to more frequent trading.
Performance: Passive funds are often viewed as long term better performing alternatives to traditional actively managed funds, which are typically more expensive. By design, passive funds track the index they replicate, so their performance depends on the index's performance. Research shows that, on average, more active funds perform below the index than above it, leading many to prefer passive funds.
However, the investment fund market includes many poor-quality funds that drag down the average growth of active funds. Quality active fund managers can achieve returns that passive funds cannot replicate, resulting in some actively managed funds to outperform passive counterparts considerably.
The Best Passive Funds
Below we feature 8 of the best performing passive funds that have consistently outperformed their sector peers, over the past 1, 3 & 5 years. These passive funds represent some of the top investment opportunities across various sectors for UK investors.

HSBC Pacific Index
Launched in 1998, the HSBC Pacific Index fund currently manages £737.39 million of investors’ assets. The fund aims to deliver long-term capital growth over 5 years or more by tracking the FTSE World Asia Pacific excluding Japan Index.
The HSBC Pacific Index fund has demonstrated strong performance over recent years, delivering returns of 15.36% over 1 year, 8.36% over 3 years, and 40.99% over 5 years. These figures significantly outperform the average returns of the IA Asia Pacific ex Japan sector, which saw 10.47%, -4.88%, and 24.27% over the same periods, respectively.
This outperformance highlights the fund’s effectiveness in capturing the growth potential of the Asia-Pacific markets, particularly in comparison to its sector peers. The fund’s passive strategy, which tracks the FTSE World Asia Pacific ex Japan Index, has proven to be a cost-effective way for investors to gain exposure to this dynamic region. Its diversified portfolio across key markets like China, Australia, and South Korea has provided a strong foundation for these impressive returns.
The HSBC Pacific Index fund's ability to consistently outperform sector averages, coupled with a cost-effective management approach and a low ongoing charge of 0.15%, makes it a compelling choice for investors seeking to replicate the FTSE World Asia Pacific excluding Japan Index.
iShares Pacific ex Japan Equity Index Fund (UK)
The iShares Pacific ex Japan Equity Index Fund (UK) has consistently delivered impressive returns, outperforming both its index and the sector average. Over the past 1, 3, and 5 years, this fund has achieved growth of 15.62%, 9.21%, and 42.86%, respectively. These returns not only surpass the average returns of the IA Asia Pacific ex Japan sector - which were 10.47%, -4.88%, and 24.27% over the same periods - but also edged out the performance of the HSBC Pacific Index fund, which returned 15.36%, 8.36%, and 40.99% over the same time frames.
This fund tracks the same FTSE World Asia Pacific ex Japan Index as the HSBC Pacific Index fund but has managed to achieve slightly higher returns. This outperformance can be largely attributed to its lower annual charge of 0.12%, compared to HSBC’s 0.16% (Fund performance is net of fund charges). This lower cost structure enhances the fund’s ability to deliver better net returns to investors.

L&G International Index Trust
The Legal & General International Index Trust I Acc Fund is a significant global equity investment vehicle, managing £5.89 billion in assets. Its primary goal is to mirror the performance of the FTSE World (ex UK) Index, which encompasses large and mid-cap companies from developed and advanced emerging markets worldwide, excluding the UK.
The fund has demonstrated impressive performance, significantly outpacing sector averages across various time frames. In the past year, it delivered a 23.10% return compared to the sector's 17.22%. Over three and five-year periods, the fund's returns of 33.10% and 76.70% respectively have substantially exceeded sector averages of 17.08% and 40.98%, showcasing its consistent growth potential.
Employing a passive investment strategy, the fund closely replicates the Index's composition. This approach results in a well-diversified portfolio with substantial allocations to key sectors such as Technology, Financial Services, and Healthcare. Geographically, the fund maintains significant exposure to major markets including the United States, Eurozone countries, and Japan.
With a competitive ongoing charge of 0.13%, the fund offers investors cost-effective access to broad global market exposure. Its diversified structure across sectors and regions helps mitigate risk while supporting steady growth, making it an attractive option for investors seeking passive global equity exposure.
Fidelity Index World P
The Fidelity Index World P is one of the best performing passive funds, consistently outpacing its sector averages with impressive returns in the IA Global sector. The fund is designed to track the performance of the MSCI World (Net Total Return) Index, and over the past year, it achieved a return of 23.77%, and over 3 years, it delivered an impressive 34.88%, significantly exceeding the sector averages of 17.22% and 17.08%, respectively. Its five-year performance is particularly noteworthy, with a growth of 76.91% compared to the sector average of 56.22%.
The Fidelity Index World fund currently manages approximately £8.67 billion, which represents a significant percentage of the IA Global sector which has 510 funds which combined hold £205.4 billion of client money.
The fund mainly invests in large-capitalisation companies, diversifying across various sectors. This broad diversification ensures that the fund remains resilient against market volatility and provides steady growth opportunities. By closely replicating the MSCI World Index, it allows investors to benefit from global market growth without the high fees of active management.
SPDR MSCI Emerging Markets Small Cap ETF
Launched on 13 May 2011, the SPDR MSCI Emerging Markets Small Cap ETF has demonstrated strong performance in global emerging markets over 1, 3, and 5 years.
The fund's performance has been noteworthy, with returns of 19.53%, 17.43%, and 58.41% over the past 1, 3, and 5 years respectively. These figures significantly outpace the IA Global Emerging Markets sector averages of 12.3%, -6.96%, and 19% for the same periods, highlighting the fund's ability to generate superior returns in this niche market segment.
The SPDR MSCI Emerging Markets Small Cap ETF is a specialised investment vehicle that targets the small-cap segment of emerging market economies. This fund focuses on smaller, often overlooked companies within rapidly developing markets, aiming to capture the growth potential of businesses in their early stages of development. This approach offers investors a unique opportunity for diversification and high growth potential.
A key strength of the SPDR MSCI Emerging Markets Small Cap ETF is its broad exposure to a diverse range of sectors across various emerging markets, including countries like China, India, Brazil, and South Korea. These economies are known for their dynamism and significant growth potential. The fund's small-cap focus allows it to tap into niche markets and industries often underrepresented in large-cap or broad emerging market indices.

Xtrackers MSCI USA Information Technology ETF 1D
The Xtrackers MSCI USA Information Technology ETF 1D, with assets under management of £1.36 billion, has consistently ranked among the top passive funds in the North American sector. This fund's primary objective is to track the performance of the MSCI USA Information Technology Index, before fees and expenses.
The underlying index, derived from the MSCI USA Index Parent Index, represents the performance of large and mid-capitalisation USA technology companies, capturing approximately 85% of the available market capitalisation. The fund employs a passive investment strategy, closely replicating the index by acquiring most of its constituent shares in similar proportions.
The fund reinvests dividends after tax and may utilise derivatives and securities lending to manage risk, reduce costs, and potentially enhance returns. This approach has yielded impressive results, with the fund delivering robust returns of 46.58% and 78.63% over the recent 1 year and 3 year periods, respectively. These figures significantly outperform the sector averages of 24% and 32.18% for the same time frames.
The fund's five year performance is particularly noteworthy, achieving a remarkable growth of 211.48% and securing the top position out of 187 funds in its category. This performance reflects the difficulties actively managed funds have had in recent years within this sector. This consistent outperformance underscores the fund's effectiveness in capturing the growth potential of the US technology sector.
L&G Global Technology Index Trust
The L&G Global Technology Index Trust I Acc fund, established in 2000, currently manages £3.53 billion in assets. Its primary objective is to track the performance of the FTSE World Technology Index, which encompasses over 400 leading technology companies across various sub-sectors including software, semiconductor equipment, and IT services. The index features prominent names such as Apple, Microsoft, NVIDIA, Broadcom, Cisco Systems, and Taiwan Semiconductor Manufacturing.
To achieve its goal, the fund employs a replication strategy, investing almost entirely in company shares that closely match the composition of the Index. This approach has yielded impressive results, with the fund delivering robust returns of 45.95%, 69.67%, and 207.42% over the past 1, 3, and 5 years respectively. These figures significantly outperform the sector averages of 32.4%, 25.13%, and 116.64% for the same periods, positioning the fund as one of the top performers in its category.
As a passive index fund, the L&G Global Technology Index Trust I Acc offers investors a cost-effective and straightforward method to gain broad exposure to the global technology sector. This investment vehicle provides instant diversification across both established technology giants and innovative emerging companies based in the United States, Asia, and other developed markets.
Invesco FTSE RAFI UK 100 UCITS ETF
The Invesco FTSE RAFI UK 100 UCITS ETF is a passively managed exchange-traded fund that tracks the FTSE RAFI UK 100 Index. This fund employs a unique approach to index construction, utilising fundamental factors rather than market capitalisation to determine company weightings.
The ETF's performance has been notably strong, consistently outpacing its sector average. Over the past year, it delivered a return of 17.65%, significantly exceeding the IA UK All Companies sector average of 14.34%. Its three-year performance is even more impressive, with a return of 37.12% compared to the sector average of 9.73%. The five-year performance further underscores its effectiveness, with the fund returning 38.877% against the sector average of 25.28%.
The fund's strategy involves selecting and weighting the 100 largest UK companies based on four fundamental measures: book value, cash flow, sales, and dividends. This methodology aims to potentially reduce overvaluation risks associated with market-cap weighted indices and may capture value opportunities more effectively.
By focusing on these fundamental factors, the ETF provides investors with exposure to UK large-cap equities that demonstrate strong financial health and value characteristics. This approach can result in a portfolio that differs significantly from traditional UK equity indices, potentially offering a unique risk-return profile.
The Invesco FTSE RAFI UK 100 UCITS ETF's consistent outperformance of sector averages highlights the potential benefits of its fundamental weighting strategy. It offers investors a cost-effective way to access this alternative approach to UK equity exposure, which has proven effective over various time horizons.

Summary
In conclusion, the passive fund market in the UK has experienced a remarkable rise in popularity, now exceeding £560 billion. This expansion reflects a broader shift in investor preferences towards lower fees and more predictable returns. Our analysis of 563 passive funds available to UK investors reveals a diverse landscape of performance, with some funds standing out as exceptional performers while others lag behind.
The eight top performing passive funds we've highlighted demonstrate the potential for consistent outperformance across various sectors. From the HSBC Pacific Index fund's strong showing in Asia-Pacific markets to the Invesco FTSE RAFI UK 100 UCITS ETF's unique fundamental weighting approach in UK equities, these funds offer compelling options for investors seeking exposure to different market segments.
However, it's crucial to remember that not all passive funds are created equal. Our findings show that while 107 funds received high performance ratings, over half of the analysed funds underperformed relative to their sector peers. This underscores the importance of thorough research and careful selection when investing in any fund whether passive or actively managed.
Ultimately, the growth of the passive fund market offers exciting opportunities for cost-effective, diversified investing. However, success in this arena requires more than simply choosing any passive fund. It demands a thoughtful approach, considering factors such as fund strategy, performance history, and sector exposure. Armed with the insights from our comprehensive analysis, investors are better equipped to navigate this dynamic market and potentially reap the rewards of well-chosen passive investments.
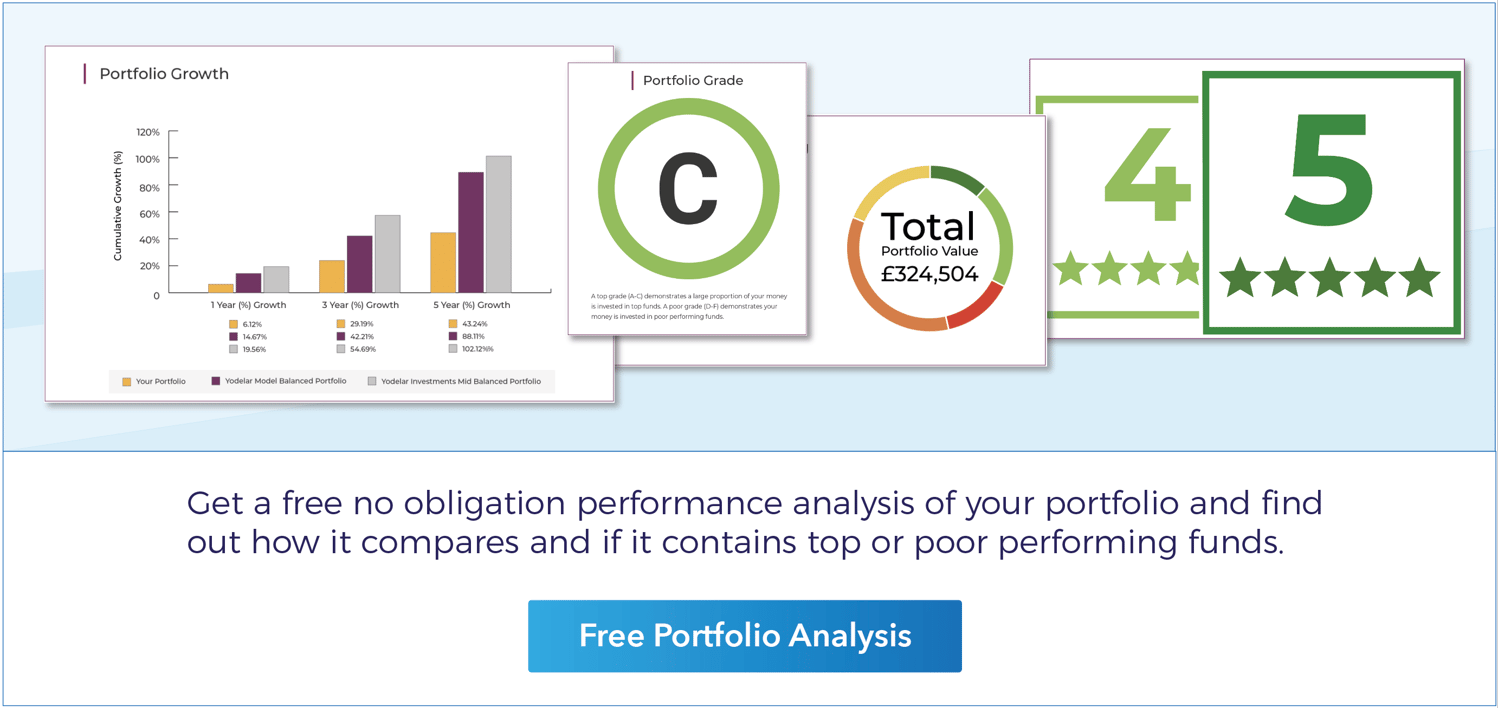
Evaluate Your Portfolio's Performance with a Free Portfolio Analysis
For years, Yodelar has analysed the performance and quality rating of portfolios for thousands of UK investors. Our extensive analysis has uncovered that over 90% of investors hold portfolios containing inefficiencies that stunt growth potential, resulting in many UK investors to miss out on enhanced portfolio growth.
Inefficient investing can have adverse long-term consequences, making it crucial to identify and correct any portfolio deficiencies.
Our industry leading portfolio analysis service enables investors to find out how their portfolio compares to a similar risk-profile portfolio constructed with top-performing funds. This unique tool provides measurable ratings that offer complete transparency into the quality of individual fund choices and the overall portfolio's competitiveness.
By utilising our portfolio review feature, investors gain detailed insights into the performance of their investments and can determine whether their current approach is optimally positioned for growth.
Key Benefits Include:
- Assess the performance of each fund
- See where each fund ranks within its sector over 1, 3, and 5 years
- Find out each fund's performance rating between 1 to 5 stars
- Identify the proportion allocated to top, mediocre, or underperforming funds
- Compare portfolio growth against model portfolios built with consistently top-performing funds
- Receive an overall portfolio performance grade from A to F