61% of investment portfolios deliver below average returns, with portfolios from the most popular risk category averaging 5-year growth that was almost 25% lower than the industry average.
These startling figures were obtained from an extensive performance analysis of more than 3,000 funds, their sectors, asset classes and 5 industry recognised asset allocation models.
From this analysis, we calculated the average portfolio growth investors would have had if, over the recent 1, 3 & 5 years, they invested in funds with just mid-range performance.
To assess how these figures compare to actual portfolios, we analysed the portfolios of 100 different UK investors and found that in some instances, their performance was significantly below the estimated average.
In this report, we feature the average performance of portfolios within each risk category, the estimated returns investors should have averaged and how much growth they could have achieved from a top-performing portfolio.
We also look at why most investment portfolios are underperforming, and how investors or their advisers can identify deficiencies and maximise their portfolio performance.
About This Analysis
There are several asset classes. Each asset class is a grouping of investments that exhibit similar characteristics and are subject to the same laws and regulations. The main asset classes are equities, bonds and cash equivalent or money market instruments.
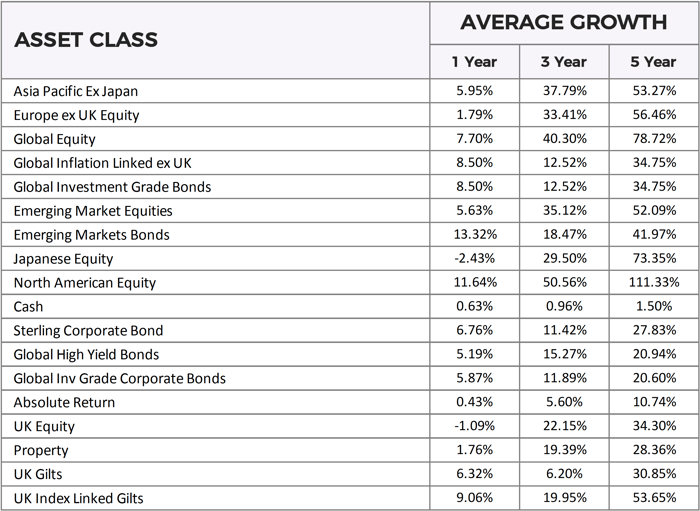
Under these main asset classes are a more focused range of assets types that are typically specific to regions, such as UK Equities, North America Equities, etc. To identify the average performance for each asset class we analysed over 3,000 funds and, based on each fund’s primary asset class, we could determine the average growth for that asset class.


By using the average growth from each asset class we then constructed a range of risk rated investment portfolios using 5 different asset allocation models.
These asset allocation models included those from the UK’s leading risk profiler Dynamic Planner, fund supermarket Hargreaves Lansdown, fund management giant Vanguard, investment platform A.J Bell, and the consumer watchdog Which?
We then took the growth from each portfolio, within their representative risk profile, to determine the overall midpoint average a portfolio should have grown by over the recent 1, 3 & 5 years.
What The Average Portfolio Growth Should Have Been
Our extensive analysis produced some remarkable findings and highlights how inefficient the majority of investment portfolios are.

*Growth figures have been calculated using the average performance figures of each asset class. These figures have then been weighted using several industry recognised asset allocation models. The above figures represent the average growth for each risk classification.
The estimated average portfolio growth was, with the exception of the higher risk portfolios of 7, 8 and 9, notably greater than the actual 5 year average investors got from their actual portfolios.
UK Investors Get Below Average Returns From Their Investment Portfolios

*An analysis of 100 investment portfolios with combined assets of £43.2 million found that the actual portfolio returns for UK investors were below the calculated average, in particular from portfolios in the mid to lower risk range.

*The above figures identifies the level of risk UK investors assume from their portfolios.
The most popular risk bracket was portfolios in the mid risk level 5 and 6 range, with these 2 risk categories accounting for 46% of the UK investment portfolios that we analysed. Portfolios within these 2 risk categories averaged 5-year growth of 36.17% and 50.37%. In comparison, the estimated average from our comprehensive performance review identified that portfolios within these 2 risk brackets should have averaged growth of 45.03% and 51.16%.
Based on our analysis, a portfolio with a risk category of 5 that was valued at £100,000 five years ago would now, on average, be worth £136,170. But if the portfolio maintained the same level of performance based on the calculated average from our analysis, their portfolio would be valued at £145,080, a monetary difference of £8,910. The difference is significant and highlights the potential growth investors could have achieved simply by investing in a modest portfolio that delivered middle of the road returns.

*Figures exclude potential fees and charges
Top Performing Portfolios - Yodelar Investments Portfolios
Although our analysis provides the actual average and the estimated average for portfolios with a risk rating between 2 and 9, efficient investors can undoubtedly achieve even greater returns.
Portfolios that contain funds that primarily outperform their competitors and fit within a suitable asset allocation model can deliver significantly higher returns without assuming greater risk. Yodelar Investments' range of risk-rated portfolios provides an excellent example of top-quality portfolios that are built to contain funds that have consistently outperformed at least 75% of their peers and have been strategically balanced to fit within each portfolio’s particular risk category.
Our analysis identified wide performance margins between average portfolio growth figures and those of Yodelar Investment portfolios.
The 8 Yodelar Investment portfolios featured in the table below are composed of a mixture of active and passive funds that have consistently ranked among the top performers in their respective sectors.

*All growth figures up to 1st August 2019
Why Are So Many Portfolios Underperforming?
The fact that the majority of portfolios underperform demonstrates a general lack of fund knowledge and an inefficiency in a portfolio’s composition and general management.
These portfolios contain funds that underperform, (funds that have consistently performed worse than at least 50% of their peers) with either the investor or their adviser unaware that their fund selection is below-par and resulted in significant missed growth.
Of course, all regulated financial advisers are held accountable to strict regulation and thorough compliance measures that are in place to ensure their clients’ protection. However, financial advisory firms are not regulated on the particular funds they advise clients to invest in. As long as their client is invested in a manner to suit their risk profile and investment needs, firms are providing suitable advice in the eyes of the regulator.
Past performance is not an indicator of future returns, but if asked, clients would prefer to invest with fund managers that consistently perform, over varying time frames, in the top 25% of performers versus fund managers that rank in the worst 25% of performers.
Fund performance is a critical metric that high-quality advice firms analyse to ensure recommended portfolios meet their client’s objectives while utilising the proven top-performing fund managers. Top advisers want to ensure the portfolios they recommend use top fund managers, and for investors who make their own fund decisions, the same should apply.
Consistently Top Performing Funds
Consistency is an important indicator of quality and success. The investment funds that have maintained a high sector ranking over continuous periods have displayed the type of consistency that reflects efficiency and expertise from the fund manager, and as such, they have proven their ability to deliver competitive returns for their clients over both the short and long term.
However, it is not always realistic for even the best fund managers to continuously maintain a level of performance from their funds that exceeds that of many of their peers. But there are certain processes that can help investors to identify when a fund is experiencing a dip in fortune, and if so, whether or not they should stick with the fund or consider moving to an alternative.
One system applied by some quality firms to track and manage fund performance is referred to as the traffic light system. This system uses a 3-tiered fund grading model that promotes a pragmatic investment approach and helps to avoid poor investment decisions.
Green – Funds that have primarily maintained a level of performance that exceeds 75% of same sector funds over the recent 1, 3- & 5-year periods. Such funds are viewed as top performers and represent excellent investment opportunities. When constructing a portfolio, it is predominantly the funds with a green rating that are considered.
Amber – Funds that have previously rated as green but recently experienced a decline in performance compared to other funds within the same sector. Amber funds remain within the portfolio but are carefully monitored, typically over a 3-6-month period, to identify whether their performance has improved, remained stagnant or declined. If the fund’s performance has improved to a level that is better than 75% of competing same sector funds, it returns to be a green-rated fund. If it remains stagnant, it will continue to receive an Amber classification for a period of up to 6 months. If no improvement is seen during this period, it will receive a red rating.
Red - The red traffic light signifies that some action is due. It may be that the fund is removed from the portfolio and replaced with a suitable green-rated fund. Funds will be moved to a red rating if they continue to drop down the sector ranking over a 3-6 month period, or if they fail to improve six months after receiving an amber rating.
Many top investment firms use the above approach to ensure the portfolios they recommend perform efficiently for their clients.
How Efficient Is Your Portfolio?
This report identifies that the majority of investors are missing out on extra portfolio growth due to subpar fund choices and general inefficiencies in their portfolio.
Inefficient investing will undoubtedly have adverse long-term consequences, which is why it is so important to be able to identify and correct any portfolio deficiencies.
Yodelar's free portfolio review service has helped thousands of investors to identify areas for improvement and provides complete clarity as to the quality of advice they have received, or the fund choices they have made.
Our portfolio review service will provide an independent analysis of your portfolio and identify:
⇔ If your portfolio contains top, mediocre or poor performing funds
⇔ How your portfolio growth compares to a similar risk portfolio of top-performing funds
⇔ How efficient your fund choices you have been, or whether the recommendations you have received from your adviser has been up to par.
⇔ Potential areas for improvement
⇔ The overall quality rating of your portfolio
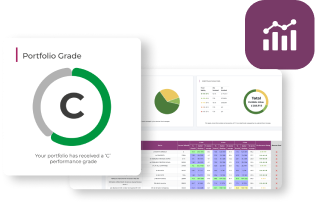
Our portfolio analysis feature provides a clear insight into how each of your individual funds is performing while grading your portfolio based on its overall performance - making it easy to identify weak points or areas for potential improvement.
Click on the link below and find out how competitive your portfolios performance has been and if the advice you have received to date has been up to par.
Claim your complimentary portfolio review >>


