- Among the 3,637 funds analysed, 57% of active funds delivered returns below the sector average over 5 years, while only 40% of passive funds underperformed, showcasing the stability of passive strategies.
- Over the past 1, 3 & 5 years, the Royal London Global Equity Select M Fund has been one of the top-performing active funds in the IA Global sector, with returns of 26.44%, 58.66%, and 135.86%, respectively.
- 8.6% of passive funds received a top 5-star rating, indicating consistent outperformance, compared to just 5.1% of active funds.
- The L&G Global 100 Index Trust I has been among the top-performing passive funds in the IA Global sector over the past 1 and 3 years.
- Over the past 5 years, the Invesco EQQQ NASDAQ 100 ETF delivered a return of 144.94%, securing the top position out of 188 funds in the IA North America sector.
When it comes to investing, one of the key decisions facing investors is the choice between passive and actively managed funds. Passive funds track a specific index, offering a low-cost, hands-off approach. In contrast, actively managed funds rely on fund managers to make strategic decisions aimed at outperforming the market.
Both approaches have their proponents, with passive funds often touted for their lower costs and consistent market-matching returns, and active funds praised for their potential to outperform the market.
This article provides an objective comparison of these two investment strategies, examining their performance to help investors make more informed decisions.

Understanding Passive and Active Investing
Passive Investing: Passive investing aims to replicate the performance of a specific market index. These funds invest in the same companies as their chosen index, maintaining a fixed structure with minimal changes. There is no active fund manager making daily investment decisions. This approach typically results in lower costs due to reduced need for constant analysis and trading. Passive investing appeals to those seeking a cost-effective, stable, and transparent way to invest in markets over the long term.
Active Investing: Active investing involves fund managers making decisions on which assets to buy and sell, aiming to outperform a specific market benchmark. This approach relies on market research and analysis to identify opportunities and adjust portfolios based on market conditions. Active investing offers flexibility to respond to market trends and events in real time. However, it generally incurs higher fees due to management costs and frequent trading. While active investing presents the potential for higher returns, it also carries greater risk and unpredictability compared to passive strategies.
Both approaches have their merits, and the choice between them depends on an investor's goals, risk tolerance, and beliefs about market efficiency.
Efficient Investing With Yodelar - Book a no obligation call with a Yodelar Investment adviser and discover more about our range of risk rated portfolios
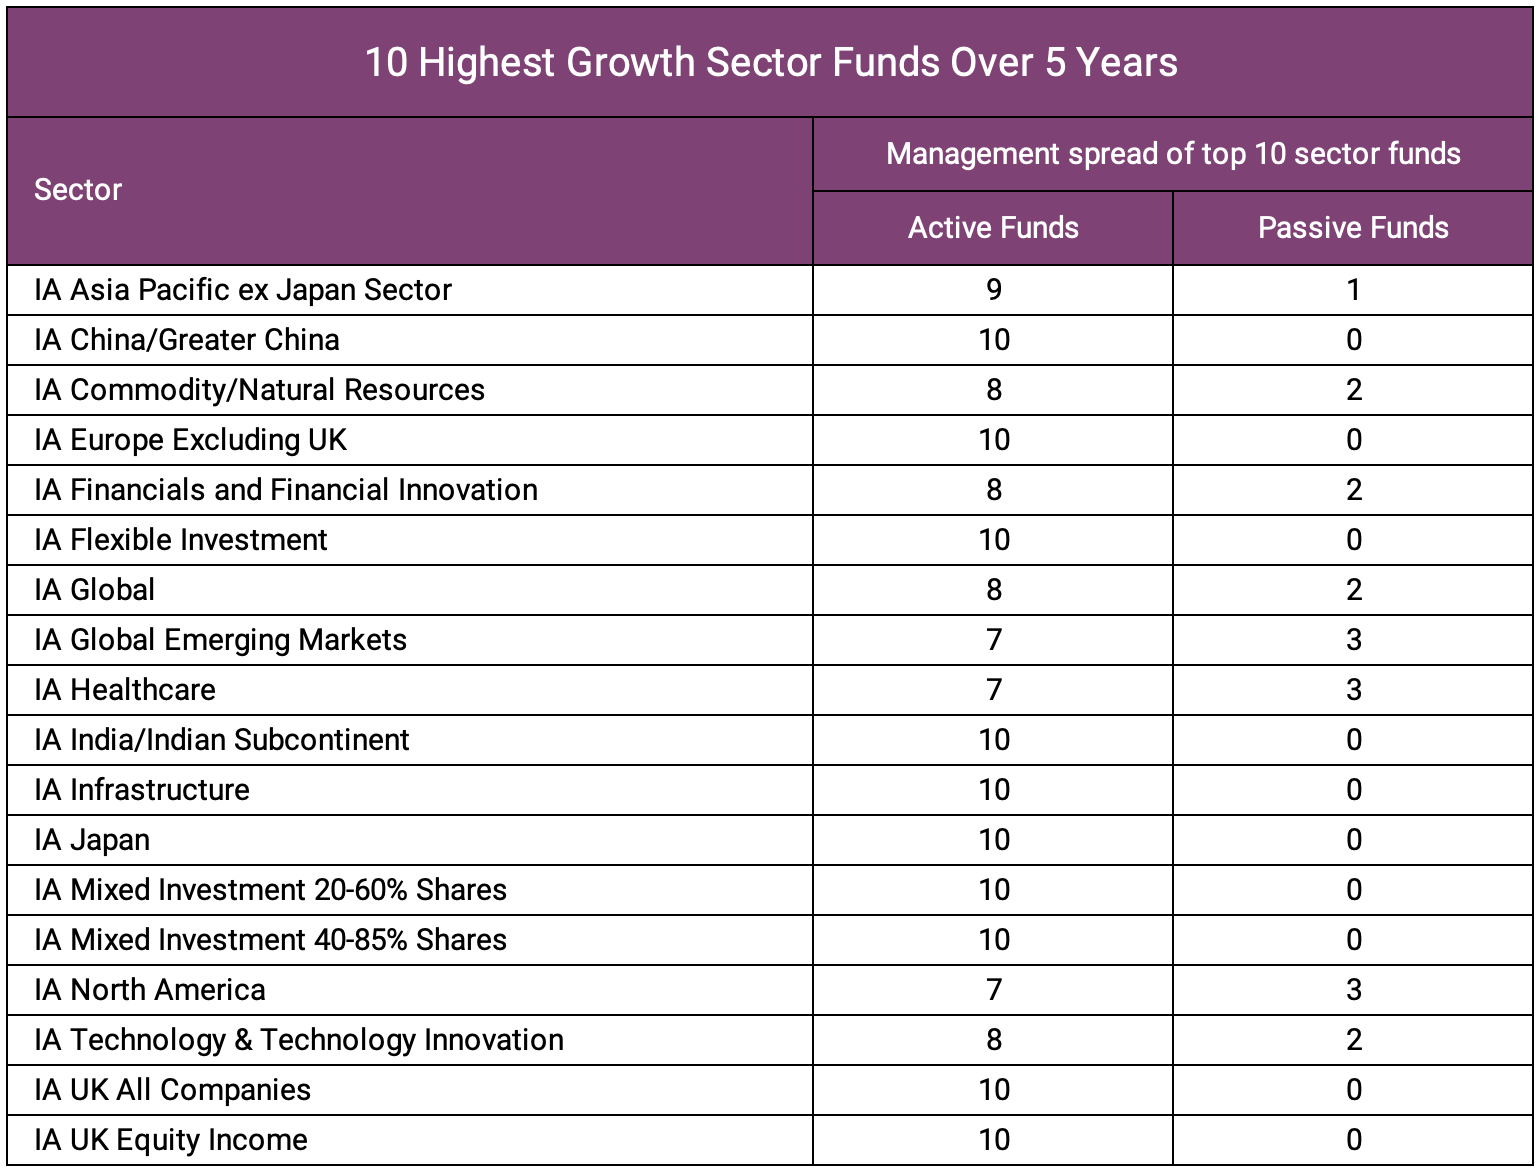
10 Highest Growth Sector Funds Over 5 Years
Our comprehensive analysis of 3,637 funds over a five-year period reveals notable insights into the performance of actively managed and passive funds. The data shows that 57% of actively managed funds delivered returns below their respective sector averages. In contrast, only 40% of passive funds underperformed their 5-year sector averages.
This performance difference becomes more interesting when we examine the top performers in each sector. Despite the overall trend, actively managed funds consistently dominate the highest positions of performance. This pattern can be attributed to the fundamental nature of passive and active investing strategies.
The table below summarises the distribution of the top 10 highest growth sector funds over 5 years, categorising them into active and passive funds across various sectors. This data illustrates how actively managed funds, despite their higher overall rate of underperformance, still manage to secure the top positions in terms of returns within their respective sectors.
This analysis underscores the complexity of the investment landscape. While passive funds offer more consistent performance relative to their benchmarks, actively managed funds present the potential for higher returns, albeit with increased risk. The choice between these strategies ultimately depends on an investor's risk tolerance, financial goals, and belief in the potential for active management to deliver superior returns.
Which Performs Better? Active Versus Passive Fund Rating Comparison
We evaluated the performance of both active and passive funds across multiple sectors and assigned ratings from 1 to 5 stars based on their outcomes. This rating system reflects the consistency and effectiveness of the funds, with 1 being the lowest and 5 being the highest, highlighting those that have consistently outperformed or underperformed their peers in their respective sectors.
The table below indicates that a notably higher proportion of actively managed funds received a poor 1 or 2-star performance rating.
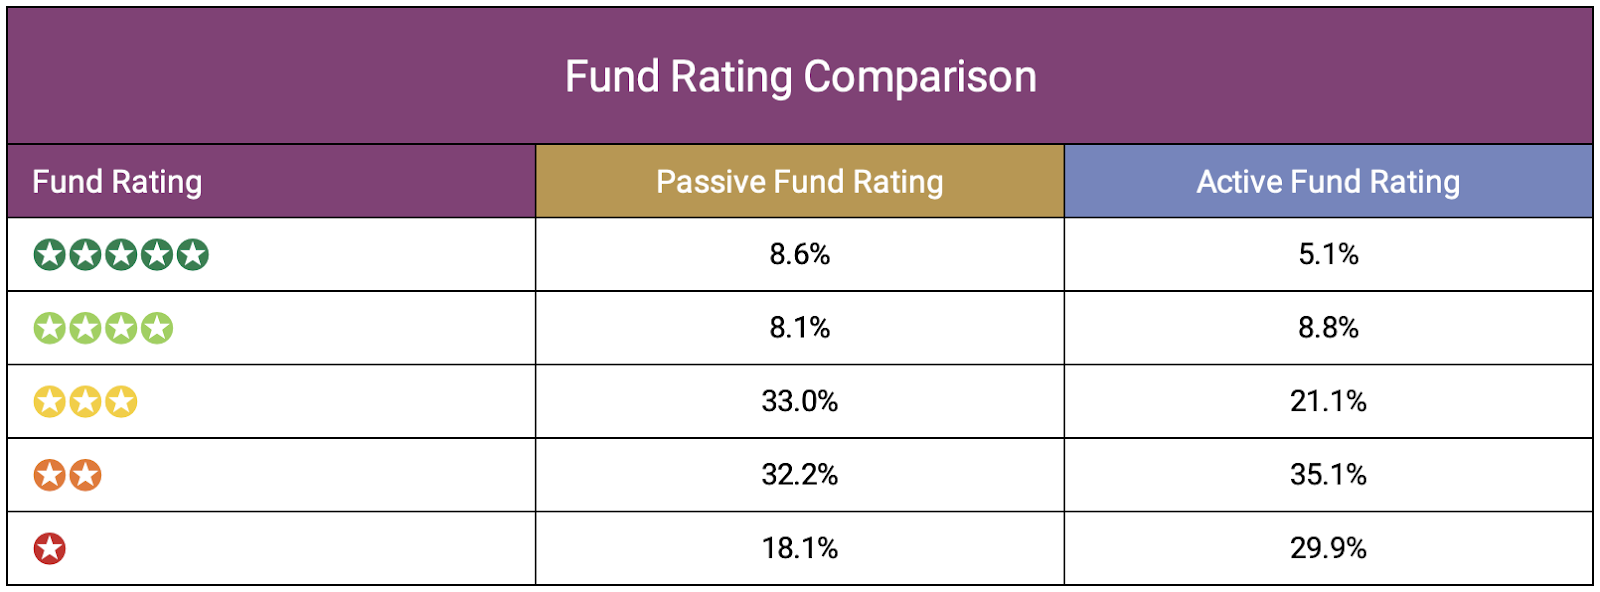
Our performance analysis shows that passive funds generally provide more consistent results compared to active funds. About 8.6% of passive funds received a top 5-star rating, higher than active funds. This outcome reflects that these passive funds have consistently outperformed at least 75% of their peers within the same sector.
Similarly, 8.1% of passive funds were rated 4 stars, while 8.8% of active funds achieved the same rating, showing comparable performance.
However, a notable disparity appears at the lower end of the performance spectrum. A large proportion, 29.9% of active funds, received the lowest 1-star rating, and 35.1% were rated 2 stars. These lower ratings imply that these active funds have consistently lagged, performing worse than at least three-quarters (75%) of their competitors within the same sector. This highlights a higher probability for active funds to underperform than their passive counterparts.
Our findings suggest that while active funds can offer the potential for higher rewards, they also carry a greater risk of underperformance. Passive funds, on the other hand, tend to deliver more stable returns, with fewer funds falling into the lower performance categories.

Active vs Passive Funds- Sector Performance Over 5 Years
The table below highlights the difference in performance between active and passive funds compared to their sector averages over 5 years.
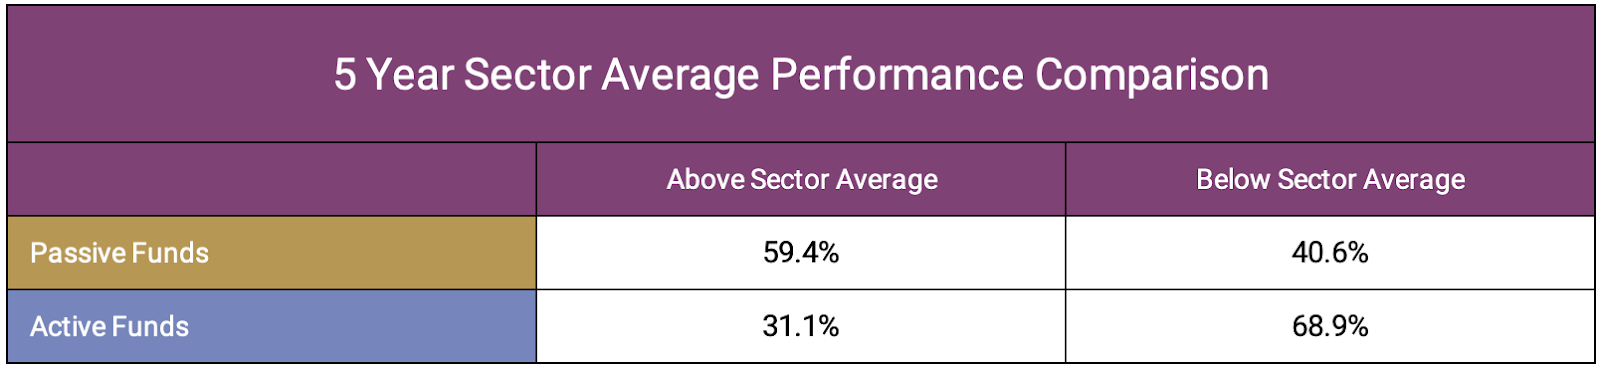
Our analysis shows that the majority of actively managed funds have struggled, with 68.9% falling below their sector average, indicating a higher likelihood of underperformance.
In contrast, 59.4% of passive funds have exceeded their sector average, demonstrating more consistent success and stability within their respective sectors.
5 Highest Growth Active Funds
We analysed the performance of all funds within 5 of the most popular sectors to identify the best performing active funds over the past 5 years.
The table below details each fund's performance, sector ranking, sector average, and overall rating.
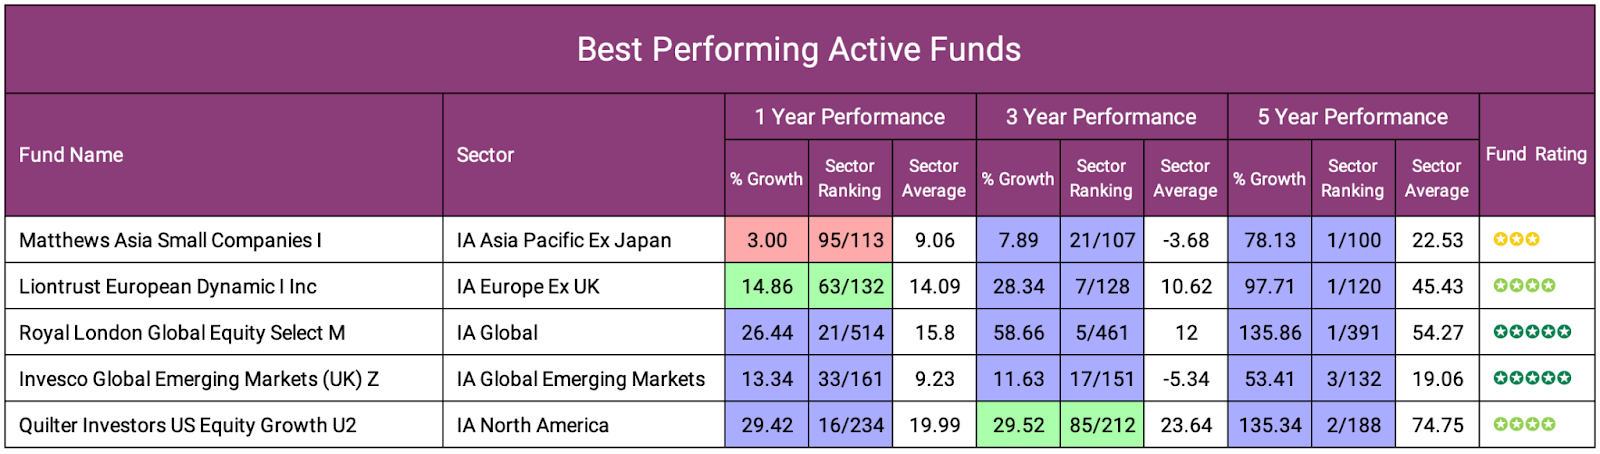
For 3 of the 5 sectors active funds have been the top growth funds, with the global emerging markets sector and North America sectors the 2 where a passive fund had the highest 5 year returns
Matthews Asia Small Companies
The Matthews Asia Small Companies Fund has demonstrated exceptional performance within the IA Asia Pacific ex Japan sector over the past five years. As of the most recent data, it has emerged as the top-performing fund among all 100 funds in its sector, delivering impressive growth of 78.13%. This performance significantly outpaces the sector average of 22.53%, highlighting the fund's ability to generate substantial returns for investors.
This fund's focus on small companies in the Asia Pacific region, excluding Japan, appears to have been a successful strategy. Small companies often have greater growth potential compared to their larger counterparts, and this seems to have played out well in the Asian markets over the past five years.
The fund's outperformance by more than 55% over the sector average is noteworthy. It suggests that the fund managers have been particularly adept at identifying promising small companies in the region and capitalising on their growth potential.
However, it's important to consider that investing in small companies and emerging markets can carry higher risks. The fund's exceptional performance may come with higher volatility compared to funds that focus on larger, more established companies.
Liontrust European Dynamic I Inc
The Liontrust European Dynamic I Inc fund has consistently outperformed its peers in the IA Europe ex UK sector over the past five years. With a remarkable growth of 97.71%, it has claimed the top position out of 120 funds in the sector. This achievement significantly exceeds the sector average of 45.43%, showcasing the fund's ability to deliver exceptional returns.
The fund’s strategy of focusing on high-growth opportunities across European markets has been highly effective. By targeting companies with robust growth potential and adaptability, it has successfully captured value from Europe’s shifting economic landscape, particularly in areas benefiting from innovation and recovery.
The fund’s performance, which outstrips the sector average by over 50%, highlights the strength of its management team in identifying and investing in companies with strong growth trajectories. This success points to a well-executed, disciplined investment process that has taken full advantage of market opportunities.

Royal London Global Equity Select M
The Royal London Global Equity Select M fund has consistently delivered strong performance across multiple time periods, outperforming its sector. Over the past year, the fund achieved a return of 26.44%, significantly above the sector average of 15.8%.
Over the three-year period, the fund recorded growth of 58.66%, more than four times the sector average of 12%. This demonstrates the fund’s effective global stock selection and strategy.
The five-year performance of the fund stands at 135.86%, ranking 1st in its sector and significantly exceeding the sector average of 54.27%. This consistent outperformance highlights the fund's ability to capture growth opportunities in global equity markets.
The fund uses a growth-focused strategy, selecting high-quality companies at optimal stages of their growth cycles to build a concentrated yet balanced portfolio. This approach allows it to tap into opportunities across various sectors while managing risks and reducing style biases.
Invesco Global Emerging Markets Fund (UK) Z Acc
The Invesco Global Emerging Markets Fund (UK) Z Acc aims for long-term capital growth, typically over five years or more. It invests at least 80% of its assets in shares or other equity-related securities of companies that are either incorporated, domiciled, or conduct the majority of their economic activity in emerging markets worldwide.
The fund has demonstrated remarkable performance over recent years, delivering returns of 13.34% over 1 year, 11.63% over 3 years, and 53.41% over 5 years. These returns have significantly outperformed the average returns of the IA Global Emerging Markets sector, which recorded 9.23%, -5.34%, and 19.06% over the same periods, respectively.
This outperformance, driven by the fund's disciplined value-focused strategy, makes it an attractive option for investors looking to tap into growth opportunities in developing economies.
Quilter Investors US Equity Growth U2
The Quilter Investors US Equity Growth Fund U2 Acc GBP is a standout performer in the IA North America sector, consistently surpassing sector averages with notable returns.
Over the past year, the fund has delivered a return of 29.42%, significantly higher than the sector average of 19.99%. Over three years, it achieved growth of 29.52%, ranking it among the top 50% of funds in the sector. Looking at the 5-year horizon it generated a return of 135.34%, far above the sector average of 74.75%. These returns underscore the fund's ability to take advantage of market dynamics and leverage the strength of the US equity market, particularly in sectors driven by technological advancements and innovation.
The fund focuses on large-capitalisation US companies, targeting stable growth while carefully managing risk. This strategy allows investors to benefit from the stability and potential of established market leaders without the added complexity of high-risk investments.
5 Highest Growth Passive Funds
Below we identify the 5 best performing passive funds across the same 5 sectors. For 2 of the 5 sectors passive funds had the highest 5 year returns whereas for european equity sector active funds have dominated the top performers with the top performing passive fund ranking 29th out of 120 funds.
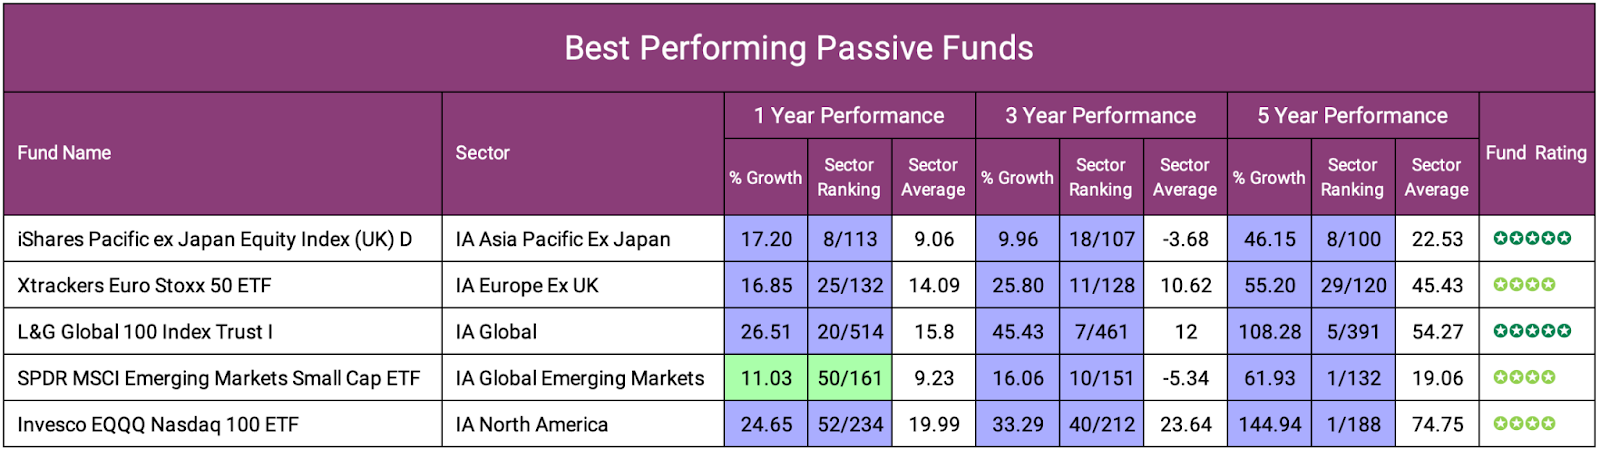
iShares Pacific ex Japan Equity Index (UK) D
Launched in 2005, the iShares Pacific ex Japan Equity Index (UK) D fund currently manages approximately £1.2 billion of investors' assets. The fund aims to deliver a return on investment by closely tracking the performance of the FTSE World Asia-Pacific ex-Japan Index, its benchmark.
The fund has shown robust performance in recent years, delivering returns of 17.20% over 1 year, 9.96% over 3 years, and 46.15% over 5 years. These figures surpass the average returns of the IA Asia Pacific ex Japan sector, which were 9.06%, -3.68%, and 22.53% over the same periods, respectively.
This strong performance underscores the fund’s effectiveness in capturing growth opportunities across the Asia-Pacific markets, particularly when compared to its sector peers. The fund's passive investment strategy, which replicates the FTSE World Asia-Pacific ex Japan Index, offers investors a cost-effective means to gain exposure to this dynamic region.
Its diversified holdings across key markets such as Australia, South Korea, and Hong Kong have created a solid foundation for generating these returns. With a low annual charge of 0.12%, the fund remains a highly efficient option for those looking to invest in developed Asia-Pacific markets.
Xtrackers Euro Stoxx 50 ETF
The Xtrackers Euro Stoxx 50 ETF seeks to provide a return on investment by tracking the performance of the Euro Stoxx 50 Index. This index comprises 50 of the largest companies from the Eurozone, representing key sectors of the economy. Some of the fund's major holdings are prominent companies like ASML Holding NV, SAP SE, and LVMH Moet Hennessy Louis Vuitton SE, which are leaders in their respective industries.
This ETF manages approximately £6.5 billion in assets and has delivered strong performance, consistently outperforming its sector averages. Over the past year, it returned 16.85%, surpassing the sector average of 14.09%. Its three-year performance is even more impressive, with a growth of 25.80% against the sector average of 10.62%. Over five years, the ETF achieved a return of 55.20%, well above the sector average of 45.43%, highlighting its ability to provide substantial returns over a longer term. These outcomes place it among the top-performing passive funds in the IA Europe Ex UK sector.
The ETF uses full replication to track the Euro Stoxx 50 Index, which means it invests in all the stocks that make up the index, in the same proportions. The ETF's success is due to its focus on stable, large-cap Eurozone companies, providing a balanced mix of risk mitigation and growth potential. Its low-cost structure also makes it a compelling option for investors seeking diversified exposure to leading Eurozone equities without high fees.

L&G Global 100 Index Trust
The L&G Global 100 Index Trust I Acc fund is a significant global equity investment vehicle, managing £1.74 billion in assets. Its primary goal is to provide investors with capital growth by closely replicating the performance of the S&P Global 100 Index, which consists of some of the largest multinational companies worldwide. By following this passive investment strategy, the fund ensures low management costs and minimal deviation from the index.
The fund has consistently ranked among the top performers in the IA Global sector and received a high 5-star rating. Over the past year, it achieved a return of 26.51%, and over 3 years, it delivered an impressive 45.43%, significantly exceeding the sector averages of 15.8% and 12%, respectively. Its five-year performance is particularly noteworthy, with a growth of 108.28% compared to the sector average of 54.27%.
These results show the fund's strength in capturing returns from top global companies. By focusing on well-established, high-quality firms, especially in North America, the fund achieves reliable performance even in varying market conditions.
SPDR MSCI Emerging Markets Small Cap UCITS ETF
Launched on 13 May 2011, the SPDR MSCI Emerging Markets Small Cap ETF has demonstrated strong performance in global emerging markets over 1, 3, and 5 years. Over the past year, the ETF achieved a return of 11.03%, and over three years, it delivered a growth of 16.06%, both of which are above their respective sector average of 9.23% and -5.34%. Its five-year performance is particularly outstanding, with a growth of 61.93%, compared to the sector average of 19.06%, ranking it 1st out of 132 funds.
The objective of the SPDR MSCI Emerging Markets Small Cap ETF is to track the equity market performance of the small capitalisation segment of emerging economies. This fund focuses on smaller, often overlooked companies within rapidly developing markets, aiming to capture the growth potential of businesses in their early stages of development. This approach offers investors a unique opportunity for diversification and high growth potential.
A key strength of the ETF is its broad exposure to a diverse range of sectors across various emerging markets, including countries like China, India, Brazil, and South Korea. These economies are known for their dynamism and significant growth potential. The fund's small-cap focus allows it to tap into niche markets and industries often underrepresented in large-cap or broad emerging market indices.
Invesco EQQQ NASDAQ-100 ETF
The Invesco EQQQ NASDAQ-100 ETF, with assets under management of approximately £8.33 billion, has consistently ranked among the top passive funds in the North American sector. The fund is designed to replicate the performance of the NASDAQ-100 Notional Net Total Return Index, after accounting for fees. This index includes 100 of the largest U.S. and international non-financial companies listed on the Nasdaq Stock Market, based on market capitalisation.
The fund's strategy has been highly effective, as evidenced by its impressive returns. Over the past year, the fund achieved a return of 24.65%, significantly outperforming the sector average of 19.99%. Over three years, it posted a growth rate of 33.29%, again well above the sector average of 23.64%. Its five-year performance is particularly noteworthy, achieving a remarkable growth of 144.94% and securing the top position out of 188 funds in its sector.
This consistent performance of passively managed funds within the North America sector reflects the difficulties actively managed funds have had in navigating volatile markets.

Why A Mixture of Active and Passive Is Best
Our analysis reveals distinct performance patterns between active and passive funds across various time frames. Over a five-year period, 59.4% of passive funds outperformed their sector averages, demonstrating consistent and stable returns. This reliability, coupled with lower costs, makes passive funds an attractive option for long-term growth, particularly in established markets.
Active funds, while offering potential for higher returns, show a higher risk of underperformance. Our data indicates that 68.9% of active funds fell below their sector averages over five years. However, high-quality actively managed funds can capitalise on market inefficiencies and economic shifts, potentially benefiting investors in dynamic or emerging markets.
A balanced approach combining both strategies can optimise portfolio performance and improve investment outcomes. Passive funds provide a stable, cost-efficient foundation, while active funds offer opportunities for outperformance in specific sectors or market conditions. This combination allows investors to balance risk and potential reward effectively. By leveraging the strengths of each approach, investors can potentially enhance overall returns while managing risk.
For example, an investor might use passive funds for exposure to large-cap, developed markets where outperformance is challenging, while employing active funds in less efficient markets or specialised sectors where skilled management can add value. This strategic allocation can lead to more robust performance across various market cycles.
Recent trends show a growing preference for passive strategies, driven by their predictability and lower fees. However, understanding the strengths and limitations of both approaches is crucial for making informed investment decisions. The choice between active and passive funds, or a combination thereof, should align with individual risk tolerance, investment goals, and market outlook.
Our comprehensive analysis aims to equip investors with the knowledge to navigate the market landscape effectively and make well-informed investment choices that optimise their portfolio's potential for long-term success.
Evaluate Your Portfolio's Performance with a Free Portfolio Analysis
For years, Yodelar has meticulously assessed the performance and quality of portfolios for thousands of UK investors. Our comprehensive analysis has revealed that more than 90% of investors have portfolios with inefficiencies that limit their growth potential, causing many to miss out on better returns.
Inefficient investing can have adverse long-term consequences, making it crucial to identify and correct any portfolio deficiencies.
Our industry leading portfolio analysis service enables investors to find out how their portfolio compares to a similar risk-profile portfolio constructed with top-performing funds. This unique tool provides measurable ratings that offer complete transparency into the quality of individual fund choices and the overall portfolio's competitiveness.
By leveraging our portfolio review feature, investors gain a deeper understanding of their investment performance and can determine if their current strategy is positioned to maximise growth potential.
Key Benefits Include:
- Assess the performance of each fund
- See where each fund ranks within its sector over 1, 3, and 5 years
- Find out each fund's performance rating between 1 to 5 stars
- Identify the proportion allocated to top, mediocre, or underperforming funds
- Compare portfolio growth against model portfolios built with consistently top-performing funds
- Receive an overall portfolio performance grade from A to F